Around the Globe 11.08.2013

Surprise Jump in China Exports – WSJ.com.

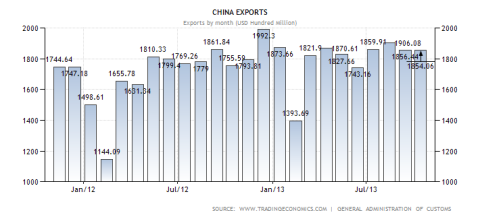
China Exports Through Oct 2013

The Wall Street Journal enjoys cheerleading the Chinese economy. Here’s the lede:

China’s exports put in a stronger-than-expected performance in October, a positive sign not only for the world’s second-largest economy but also for global demand.

The first part is an adequate reporting of the data, but the second is poor analysis.  One month’s data does not constitute a positive sign particularly in the world of foreign trade.  Chinese exports exceeding the consensus forecast is not bad news for the world economy, but stating that it is a “positive sign” constitutes hype.

The real Chinese export picture is much more complex.  As you can see, despite the MFP’s best efforts to draw conclusions from one month’s worth of data, the truth is that export growth is slowing.  This shouldn’t be surprising considering lackluster growth in China’s three largest markets, and yet here we are.

China Export Growth


In October Jobs Report, U.S. Hiring Picks Up Strongly – WSJ.com.

US consumer sentiment at 72.0 vs. 74.5 estimate.

UM Consumer Sentiment Through November 2013


The headlines read that consumer confidence unexpectedly dropped in November.  This begs the questions, “Who expected a rise?” Diving further into the article we find that an amorphous blob known as “economists.”  In light of a stagnant labor market and a government “shutdown,” I was initially surprised that the consensus an increase until I read the rest of the article.

Consumer confidence is dropping sharply among those earning less than $75k per year while high earners remain confident due to the rising stock market.  Economists generally exist in a bubble with their upper middle class colleagues, and to this group things are great.  Their 401(k) plans and incomes have steadily increased, so it is very difficult for them to recognize the dire straits that the rest of the country finds itself in.  You would think that three decreases in a row off the July peak would have made them a bit more cautious in forecasting November’s number, but then you’d be wrong.  If the whole consensus missed, then nobody missed.  There’s safety in the herd.

S&P lowers France credit rating, cites slow reform pace | Reuters.

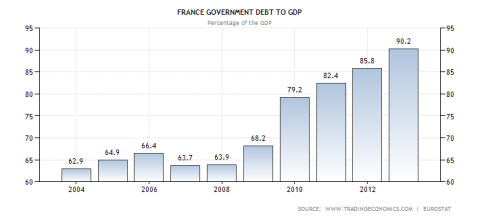
S&P cuts France’s sovereign credit rating.

S&P Cuts France’s Credit Rating by One Notch to Double-A – WSJ.com.

France Debt to GDP Ratio

Rarely does an agency ratings cut lead to a marked change in yields.  Today, the S&P cut France’s rating a half a step, and the market yawned.  On the flipside, the market is equally apathetic when ratings are increased.  When Fitch raised Spain a half a notch last month, yields barely budged.  None of this matters because France will never pay back all of this debt just like its fellow industrialized economies in the EU, North America and Asia.

ECB on collision course with Germany on banking union – FT.com.

Net Bank Assets as a Percentage of Host Country GDP


The Financial Times is hyping this disagreement between Germany and the ECB regarding centralized bank supervision.  There is no collision, and everything is fine.  Germany will simply not allow an EU institution to have control over its banking industry.  The banks are too politically connected and stuffed to the rafters with dodgy assets from all over the Eurozone.  The Germans are not alone in opposing a centralized supervisor.  Austria, the Netherlands and Finland will not surrender this sovereignty either.

ECB supervision will be watered down some before the FANG agree to the scheme.

Labor Market Data & QE Effects

Jobless, US GDP data.

Journalists are neither statisticians nor data experts, so they really do not understand how to read the deluge of economic data being constantly released.  Instead, they slavishly hew to a simplistic narrative involving unemployment claims and job creation. If either claims fall or there is positive job creation, the MFP consider this “improvement.”

This is the wrong way to view these numbers.  Both data sets must be placed into context and reviewed with other data in order to create a complete picture of the American labor market.  Jobless claims usually begin falling during a recession, and this is a leading indicator of recovery; however, low jobless claims in the middle of an expansion indicate that it is running out of steam.  You can look at the chart and see for yourself what happens after jobless claims trough.  (Hint: those gray columns indicate recessions)

Four Week Average Initial Claims through 09.27.2013

The MFP also draws the incorrect conclusions from job creation data.  The country needs about 200,000 new jobs per month to absorb new entrants into the labor force indicated by the red line:

US Monthly Job Creation

The chart does not show an “improving” labor market, but a stagnant one.  Essentially, after an initial burst of euphoria in 2010, the job market just got stuck.  As long as job creation lags behind new entrants to the labor force, the labor market neither is improving nor will it improve.

As to why the labor market remains moribund despite the best efforts of the central bank, check out this chart:

Labor Force Participation Rate vs. Fed Balance Sheet
Labor Force Participation Rate vs. Fed Assets

Must be a coincidence, huh?

Originally published 11/8/2013

Around the Globe 11.07.2013

Consumer Confidence in U.S. Drops for Sixth Consecutive Week – Bloomberg.

Bloomberg Consumer Comfort Index 11.2013

The economic data remains in definitely maybe mode.  GDP grew at a decent clip close to 3% last quarter, but this does not help us answer the most important question of the day— are Americans growing more prosperous? Well, every week they are asked, and for the last six they have responded, “No.”  In fact, removing the top 10% of earners from the survey would turn these poor results into dire ones.  As usual in the New Normal, if you were rich enough to afford a Twitter allocation today, then you’re probably doing okay.  If you’re not rich, not so much.

McKinsey Says 20% of Biggest Banks May Shrink or Merge – Bloomberg.

Credit Jobs at 10-Month Low as Borrowing Slows: EcoPulse – Bloomberg.

XLF 11.07.2013

Chart from Google Finance

After outperforming the S&P 500 for years, the financial services sector ETF diverged lower in late August.  Ongoing money printing is suppressing trading volumes while higher interest rates are simultaneously driving down new lending, particularly for mortgages.  Lower activity levels point to future industry consolidation.  The only question is will this happen through the M&A process, or will Fed-sponsored private bail-out program à la Bear Stearns?

Draghi Cuts ECB Rate to Fight ‘Prolonged’ Inflation Weakness – Bloomberg.

ECB cuts rates to new low, sees protracted low inflation | Reuters.

ECB Cuts Rates Unexpectedly as Low Inflation Threatens Recovery – WSJ.com.

USDEUR Exchange Rate vs Fed to ECB Balance Sheet Ratio

Only 3 of 70 economists surveyed believed that there would be an ECB rate cut, but Draghi surprised everyone resulting in over a 150 pips drop in the USDEUR rate.  The ECB and its German overlords must be much more concerned about future growth prospects than they have been letting on.  Unfortunately for Europe, the weaker euro is temporary.  An ongoing bank deleveraging in advance of 2014 ECB stress tests is causing banks to sell overseas assets and convert the proceeds into euros.  Meanhwhile, the ECB’s failure to maintain the Fed’s torrid printing pace is raising the ECB/Fed balance sheet ratio to levels that imply a $1.54 USDEUR rate.

Once the rate cut proves ineffective, the Germans will reluctantly permit some sort of QE to maintain a favorable exchange rate, though the pretence given will have something to do with monetary transmission channels or some other wonkish nonsense.

U.S. growth picks up in third quarter as restocking offsets weak spending | Reuters.

US Retail Sales MoM

GDP rose because firms increased inventories dramatically during the 3rd quarter.  Of that 2.8% growth rate over 80bps are attributed to rising inventories.  If firms increased stocks in anticipation of more business and they are correct, then growth may even surpass 3% next quarter.  However, if the inventory surge was caused by a glut of unsold goods, then GDP growth will slow down from now until the end of the year.

I think that even the mainstream financial press is beginning to understand the economic situation.  Today reports of 2.8% should have elicited more recovery hype, but the media’s reporting on 3rd quarter growth was rather subdued.  Or, it could be that they are just too busy hyping the Twitter IPO to have paid much attention to GDP growth.

Jobless, US GDP data.

Labor Force Participation Rate vs. Fed Assets

Journalists are neither statisticians nor data experts, so they really do not understand how to read the deluge of economic data being constantly released.  Instead, they slavishly hew to a simplistic narrative involving unemployment claims and job creation. If either claims fall or there is positive job creation, the MFP consider this “improvement.”

This is the wrong way to view these numbers.  Both data sets must be placed into context and reviewed with other data in order to create a complete picture of the American labor market.  Jobless claims usually begin falling during a recession, and this is a leading indicator of recovery; however, low jobless claims in the middle of an expansion indicate that it is running out of steam.  You can look at the chart and see for yourself what happens after jobless claims trough.  (Hint: those gray columns indicate recessions)

Four Week Average Initial Claims through 09.27.2013

The MFP also draws the incorrect conclusions from job creation data.  The country needs about 200,000 new jobs per month to absorb new entrants into the labor force indicated by the red line:

US Monthly Job Creation

The chart does not show an “improving” labor market, but a stagnant one.  Essentially, after an initial burst of euphoria in 2010, the job market just got stuck.  As long as job creation lags behind new entrants to the labor force, the labor market neither is improving nor will it improve.

As to why the labor market remains moribund despite the best efforts of the central bank, check out this chart:

Labor Force Participation Rate vs. Fed Balance Sheet

Labor Force Participation Rate vs. Fed Assets

Must be a coincidence, huh?

Spain nears year-end funding target as industrial output grows | Reuters.

Spanish Industrial Production


Despite my best efforts, the MFP’s Spanish Recovery Narrative, a subplot of the Euro Recovery Narrative continues unabated. Allow me to make another attempt by explaining this Reuter’s article passage by passage:

Spanish industry grew for the first time since early 2011 in September, data showed on Thursday, keeping investor sentiment towards the country upbeat as a strong debt sale brought the government close to hitting its 2013 funding target.

1.  As long as the ECB funds virtually 100% of peripheral debt purchases practically for free, banks will continue to buy Spanish debt.  Indeed, Eurozone TBTF banks increased their sovereign debt holdings by 26% last quarter.  This is not a sign that Spain is recovering; rather, it is a sign that the ECB has a printing press.

Calendar-adjusted industrial output rose by a surprise 1.4 percent year-on-year in September, beating expectations of a 1.5 percent contraction and marking its first growth on an annual basis since February 2011.

2.  A one month change could indicate an anomalous result.  Certainly, we should expect to see several months in a row of expanding output.  A trend like that would be something to write an article about, but an isolated rise after 25 months of contractions, meh.

Meanwhile, the Treasury easily sold 4 billion euros ($5.4 billion) in mid- and long-term bonds and has now shifted 96 percent of its 121.3-billion-euro year-end target.

An improved outlook for the Spanish economy from ratings agency Fitch also boosted demand for the 2018, 2023 and 2026 bonds offered.

That helped lower the price paid by the Treasury – a trend of declining yields that seems likely to continue following Thursday’s surprise interest rate cut by the European Central Bank, which occurred after the debt sale.

The 10-year bond yielded 4.164 percent, the lowest since September 2010 and a long way from rates of over 7.6 percent hit during the height of the debt crisis in the summer of 2012.

3.  I don’t need to explain why Spanish rate optics are improving again.  See #1 above.

Spain has languished in an economic slump since a property bubble burst in 2008, dragged down by depressed consumption in the face of record high unemployment.

That led nervous investors to demand unsustainable premiums to hold Spanish paper.

But an ECB pledge to do whatever it takes to back struggling euro zone economies, expansive monetary policies in the United States and Japan and the correction of fiscal and economic imbalances in the country have helped ease concerns.

Spain’s economy registered its first expansion in over two years in the third quarter thanks to strong exports, which also boosted capital goods production and lifted the headline industrial output figure.

“All the indicators point to a turnaround, and that we’re entering into growth. The doubt remains on whether it will be strong or weak, but it’s clear we’re passing from a period of recession to a period of growth,” said Nicolas Lopez,analyst at Madrid broker M&G Valores.

4.  The passage above is an excellent nutshell review of the Spanish Recovery Narrative topped by some encouraging words from a permabull stockbroker.  Much to most Spaniards’ great chagrin, all indicators do not point to a turnaround, only those which can be manipulated by the central bank like interest rates and stock market indices.  Now, if there were only a way to teach central banks to print well-paying jobs rather than speculative cash for the TBTF banks and corporations, you wouldn’t be reading this, and more importantly, I wouldn’t be writing this.

Fitch last week raised its outlook on Spain’s debt, adding to the wave of improving sentiment and encouraging investors to bid for relatively high-yielding paper the Treasury is selling compared to many of its euro zone peers.

Debt in the euro-zone’s once-shunned peripheral economies has attracted strong demand in recent months and Spain’s auction came after Italy raised a record 22.3 billion euros from a four-year inflation-linked bond this week.

On Thursday, the Spanish Treasury sold 4.03 billion euros, beating the targeted range of between 3 billion and 4 billion euros and clearing the way for pre-financing 2014 borrowing.

While the recent economic data has helped fuel rising optimism toward Spain, some economists were more cautious about the strength of the recovery.

“This is another strong auction of Spanish debt and a confirmation, if one were needed, that Spain’s problem isn’t on the funding front, but rather on the fiscal and economic ones,” said Nicholas Spiro, managing director at Spiro Sovereign Strategy, echoing many other analysts’ views.

Spain’s export-led recovery is weighed down by continuing dire consumer demand which is not expected to grow until record levels of unemployment are dealt with. The European Commission sees Spain’s jobless rate remaining above 25 percent to 2016 at the earliest.

“Spain, like Italy, is very much a tale of two halves: a resilient and relatively buoyant bond market and a sickly economy whose public finances are going from bad to worse,” said Spiro.

5.  Well, at last Spiro finishes up strongly for us while implying just what we explicitly stated above, specifically, that only the half of the system that can be affected by the ECB is performing adequately.

Around the Globe 11.05.2013

BOJ Gov. Kuroda Calls Easing Steps Successful – WSJ.com.

BOJ Struggles to Convince on 2% as Abenomics Shine Fades – Bloomberg.

Japan Salaries Extend Fall as Abe Urges Companies to Raise Wages – Bloomberg.

Japanese Incomes  Japanese GDP Performance Through 2Q2013

Japanese Inflation Rate


Printapalooza throughout the world continues, but the Bank of Japan is leading the world in money creation.  Printing inflates asset prices while deflating labor costs, i.e. wages.  In the first chart, note the trend of Japanese wages since the BoJ began printing over a decade ago.  It is not surprising that the Japanese economy is weak, because consumers have been on a slow, inexorable wage reduction for almost 15 years.  The current round has proven ineffective at raising GDP growth, as illustrated in our second chart.  Indeed, Japan witnessed stronger growth in the aftermath of Lehman than it is under Abenomics, which is also the last time Japanese inflation exceeded 2%.  If you examine the third chart, you can see what happened after the last three times the mainstream financial press called an end to Japanese deflation.

In the meantime, the export and stock market gains fueled by the weak yen have probably peaked.  The USDJPY exchange rate is highly correlated to the ratio between BoJ and Fed assets.  As our last chart details, the market has already priced in the more rapid expansion of the BoJ’s balance sheet.  A reduction in Fed purchases, the dreaded taper, will allow the yen to depreciate further.

BoJ to Fed Balance Sheet Ratio vs. JPYUSD


Service Industries in U.S. Grow at Faster Pace Than Forecast – Bloomberg.

Service sector exapnds more than expected in October: ISM.

U.S. service sector growth quickens in October: ISM | Reuters.

ISM NMI 11.2013

The economic data continues to tell a tale of stagnation.  The MFP is breathlessly reporting that the services PMI beat the consensus forecast despite the “shutdown.”  Numbers above 50 signal expansion, but a 55.4 is nothing to write home about.  Expected GDP growth at this level is below 2%, which is far below the 3.5% growth required to stir the labor market.

Pressure mounts on Draghi following eurozone forecasts – FT.com.

Rehn Confident Greece to Meet Targets as Troika Talks Resume – Bloomberg.

EU Forecasts Sluggish Growth as Austerity Continues – WSJ.com.

EU cuts euro zone growth forecasts for 2014.

Uncertainty over ECB caps moves in shares, euro | Reuters.

Euro Fair Value at 1.37


Everyone is trying to predict what the ECB will do on Thursday: will it cut rates or not? Most commentators seem to believe that the ECB will cut its discount rate, because the EU just cut its Eurozone growth forecast for 2014 to 1.1%.  The EU has been relentlessly cutting growth forecasts since 2010, so there is no crisis here.  The only thing you need to know about how the ECB will conduct monetary policy is contained in the chart above.

As long as the euro remains weak enough to promote German exports, there will be no rate cut to lower the euro exchange rate.  If the euro attains and maintains the low $1.40’s for a time, then there will be a rate cut.  At the current rate of $1.35, Germany is benefiting from both low inflation and a weak currency.

Around the Globe 11.04.2013

Janet Yellen’s mission impossible—Commentary.

Could QE spur deflation, not inflation?.

There are two reasons why the Fed will keep printing. 1st:

Fed Balance Sheet vs. SP500 10.2013

2nd:

US 10yr through 11.04.2013

The creation of the 401(k) years ago politicized the stock market.  The government’s policy of herding Americans into purchasing equities to fund their retirements has created an expectation that the government must do something about falling markets, so it does.  Additionally, the government must be able to finance itself.  A rise in treasury rates would result in higher deficits down the road; hence, the Fed must keep rates low and the only method currently at its disposal is the printing press, so print it does.

Ultimately, all of this printing is slowly destroying the economy, because QE is ultimately both inflationary raising assets prices and deflationary suppressing income growth.  Japan started its own money printing program in the late 90’s, and you can see for yourself how incomes are performing:

Japanese Incomes

Like the Fed, ECB expected to keep on pumping.

ECB may soon join the flight of the doves | Reuters.

Debt crisis has left Germany vulnerable – FT.com.

USDEUR Exchange Rate vs Fed to ECB Balance Sheet Ratio

The MFP and its assorted shills, hangers on and supplicants believe that the ECB will begin printing in earnest to match pace with the Fed, and it just might but not for the reasons it endlessly touts: unemployment, lower inflation and economic contraction and stagnation in the periphery.  Rather, the only thing you need to know is the USDEUR exchange rate.  When it rises to a level that threatens Germany’s export machine, then there will be an ECB rate cut and not one second before.

The chart above illustrates the relationship between the dollar/euro exchange rate and the Fed/ECB balance sheet ratio.  As you can see, the rate has diverged from its long-term relationship, but these divergences are only temporary.  The euro will continue it general, upward trend for the near future.  Once the euro crosses the $1.45 line, the ECB will consider a rate cut because this is the rate that curtails Germany exports.

China reform checklist: How to tell that this time it’s for real? | Reuters.

China 7 Day Repurchase Rate 11.04.2013


Chinese leaders enjoy discussing economic reforms almost as much as the mainstream financial press hyping said reforms.  Chinese leadership has linked economic growth with political stability.  In light of this fact, this is all you need to know about Chinese economic reforms: if the reforms have any negative consequences, they will quickly be rolled back.  The PBOC has been attempting to liberalize the financial system by stepping away and letting the banks fund each other rather than relying on central bank liqudity.  Unfortunately, whenever it begins backing out of the overnight lending market, interest rates spike, so it rushes right back in.

This is exactly how government reforms will proceed.  The government will attempt to reform the economy.  Once adverse consequences erupt, (i.e. higher unemployment, the wrong guy’s factory being shuttered) the government will reverse course in short order.  After conditions settle down, it will make another feeble attempt to reform and change its mind once the consequences return.  Rinse and repeat.

High unemployment? Blame high home ownership, study says – NBC News.com.

Unemployment versus Home Ownership


This is an interesting study.  High rates of home ownership lead to higher structural unemployment.  This study’s conclusion makes sense, and it survives a careful reading.  Renters are more mobile than homeowners, and this affects the unemployment rates.  In the chart excerpted from Dr. Oswald’s study, we can see two examples that tend to prove the rule.  Of course, there are other reasons why Greece has a drastically higher unemployment rate than Germany, which is why the country is so far above the trend line.  BTW, Greece’s neighbor on the chart is Spain.

Around the Globe 11.01.2013

US factory activity hits one-year low in Oct: Markit.

Manufacturing in U.S. Expands at Faster Pace Than Forecast – Bloomberg.

Manufacturing sector expands more than expected in October.

U.S. October manufacturing activity growth hits 2-1/2-year high: ISM | Reuters.

U.S. Factories Shrugged Off Shutdown – WSJ.com.

ISM PMI 11.2013


There are two widely followed American manufacturing indices issued by Markit Economics and the Institute of Supply Management.  In June, the indices diverged with one continuing to rise while the other began falling.  Even though both organizations released their data today, guess which one the mainstream media is choosing to write about and which one is being ignored?

The optimistic numbers from ISM are winning the news battle 41,000 google news search results to 8,500.  This morning, I saw several articles hyping the ISM’s data but none reporting Markit’s.  None of this criticism should be construed as supporting one index over the other.  In fact, they are both probably right adding to the rest of the decidedly mixed data that defines the New Normal.


Markit US Manufacturing PMI 11.2013

Draghi’s Deflation Risk Complicates Recovery: Euro Credit – Bloomberg.

Euro slips to 2-week low as talk of looser ECB policy grows | Reuters.

Euro Fair Value at 1.37

The table above illustrates the relative advantage or disadvantage of the country’s euro membership, and it is all you need to know in order to correctly predict the ECB’s next move.  Germany is essentially running the ECB, so the bank delivers the monetary policy that the Germans want.  As long as inflation remains low and the value of the euro is weak enough for Germany to maintain its export subsidy, then Draghi will hold the course steady.  If the euro begins to rise above $1.45, Germany will allow a rate cut to weaken the euro.

An expensive euro is not as unlikely as you think.  Eurozone banks are busy selling assets to raise their capital levels before the ECB stress tests.  As long as this process continues, their will be steady buying pressure on the euro.  In the meantime, the ECB is not matching the rest of the world’s central bank printing programs.  As such, the euro will continue to strengthen:

Fed-ECB Balance Sheet Ratio versus USDEUR

China property inflation quickens in October: surveys | Reuters.

China 7 Day Repurchase Rate 11.01.2013


The Chinese financial system will blow up someday, though it won’t be today.  Whenever the PBOC attempts to stop printing yuan, liquidity dries up and interest rates rise.  In response, the PBOC prints yuan and adds it to the system to ameliorate liquidity problems.  The unintended consequence of this action is a credit bubble, which is particularly evident in the frothy Chinese housing market.  Sooner or later, the Chinese will realize that holding empty apartments in empty cities is not an efficient use of capital but, again, not today.

Around the Globe 10.31.2013

U.S. jobless claims fall in better news for labor market | Reuters.

Initial Jobless Claims Through 10.26.2013

The mainstream financial enjoys reporting simplistic explanations for complex trends.  The MFP explanation of the month is the “shutdown.”  Negative data is explained away by the shutdown, while positive data is used to reinforce the recovery narrative.  A more nuanced reading of the data reveals two facts.  First, initial unemployment claims have dropped to business cycle lows.  Second, claims had begun rising in the beginning of September long before the latest government manufactured crisis.

The pace of layoffs has slowed throughout 2013 after remaining static through 2012.  it seems that initial claims have finally bottomed out over four years since the “end” of the recession, but hiring remains weak.  Last month a mere 148,000 jobs were created well under the 200,000 necessary to maintain pace with new entrants to the labor force.

Home prices are still affordable, says Shiller.

Housing Affordbability Index


Shiller does not believe that the country is in the midst of a housing bubble and this is his thinking:

“I define a bubble as a time when people have extravagant expectations, and the expectations are driving home price increases,” said Robert Shiller, Case-Shiller index co-founder and Yale University professor of economics, in an interview with CNBC. “We don’t have the mindset of earlier this century.”

What Shiller is saying is that price expectations are different now than in 2006.  This is true, but the background economic picture has also changed with these expectations.  In 2006, people believed that house prices will continue rising as rates remained low and consumer incomes were growing.  Today, people believe that house prices will continue rising despite rising rates and stagnant consumer incomes.  Isn’t today’s market just as irrational as 2006 once we take those facts into account?

These headwinds will buffet housing going forward resulting in declining sales.  Moreover, once investors realize that there is no money to be made in renting hundreds of single family home due to the lack of economies of scale in the sector, expect a housing correction to a lower sales pace at lower prices.

Germany Hits Back at U.S. Over Economic Criticism – WSJ.com.

U.S. Treasury Blasts Germany’s Economic Policies – WSJ.com.

America’s misplaced lecture to Germany | The World.

Euro Fair Value at 1.37

An unbalanced economy is a weak economy.  The old cliché is, “Neither a borrower or lender shall be,” not “A borrower shall not be, but lenders are fine.”

Export-driven economies rely on a weak currency to flood the market with their goods and thereby place two burdens upon their populations.  The cheap currency makes imports more expensive, so consumers in export-driven economies cannot afford as much.  Lower consumption levels equate to lower employment levels as the infrastructure of consumption remains lacking.

Prices for consumer goods are much higher in export countries.  In the U.S., you can buy a nice HDTV and a surround sound system for about $1500.  In Germany or the Netherlands, you couldn’t even buy the HDTV for that price.  As a consequence, the retail sector remains small and labor force participation rates remain low.

As the chart illustrates, Germany receives a very nice benefit from belonging to a currency zone with more  unproductive members, and those countries pay a steep premium to remain in the Eurozone.  Eventually, someone will figure out that he could reverse his country’s fortunes rapidly by reverting to its national currency.  Until then, the periphery will struggle, and breakup risk will persist.  He who exits first, exits best.

ECB easing hopes help stocks, bonds deflect Fed hit | Reuters.

Euro-Area Inflation Rate Falls to Four-Year Low – Bloomberg.

Fed-ECB Balance Sheet Ratio versus USDEUR

Draghi better fire up the printing press  before it is too late. The Eurozone “Recovery” has been led by a surge in exports from the periphery.  While the employment picture is still deteriorating, at least higher export orders were a bright spot.  Unfortunately, this brief upswing in exports is about to reverse course.  The Euro has been depreciating as the ECB neglects to match the Fed, the BoJ and the BoE in currency creation.  Our chart illustrates the relationship between the Fed and ECB balance sheets and the USDEUR exchange rate.  The present ratio indicates a rate of $1.54.  The strong euro has already begun to weigh on PMIs and will filter down to GDP in due course.


Around the Globe 10.29.2013

Consumer Confidence in U.S. Slumps by Most Since August 2011 – Bloomberg.

Consumer confidence much lower than expected in October.

Conference Board Consumer Confidence 10.2013

Chart from ZeroHedge

This survey confirms the results from the UMich consumer sentiment survey released Friday with both indices plummeting.  The only question regarding this data is whether this month’s plunge in the index is attributable mostly to the shutdown or to rising rates and the ongoing weak labor market.  In my opinion, the index is at or close to its recovery peak, and consumers will increase their caution in the coming months.

US small businesses boosted borrowing in September.

ThomsonReuters Paynet Index


This index is an excellent leading indicator of economic growth, and the increase in small business lending will surely boost economic growth in the coming quarter.  That’s the good news.

The bad news twofold.  First, in the chart above, observe how small business lending has yet to recover to its pre-New Normal high.   Second, growth in this sector is grinding to a halt.  The present trend is on the right.  As to where it leads, look at the arrow on the left and see for yourself.

ThomsonReuters Paynet Index Month to Month Change

Exclusive: China central bank seeks to reassure money markets after rate spike | Reuters.

China 7 Day Repurchase Rate 10.29.2013


The PBOC is attempting to manage China’s money supply first through jawboning backed with action.  China is trying to liberalize its financial system and allowing more rates to float is part of this policy.  It seems that whenever the seven day repo rate approaches 5%, the PBOC injects liquidity into the system via reverse repos.  As long as the world’s printapalooza continues, the PBOC will be unable to let these rates float and will be forced to continue injecting yuan into the sytem on a regular basis.

Around the Globe 10.28.2013

Pending Home Sales Show Sharp Drop – WSJ.com.

Pending Sales of Existing Homes Slump by Most in Three Years – Bloomberg.

Pending home sales drop 5.6 percent in September.

U.S. pending home sales fall by most in more than three years in September | Reuters.

NAR Pennding Home Index through 09.2013

The MFP is rightly attributing this fall in pending home sales to the precipitous rise in mortgage rates since May, though the NAR would have you believe that the shutdown beginning on October 1 somehow affected pending sales from September.  Houses have become dramatically more unaffordable since May from rising rates and housing prices against the backdrop of stagnant incomes.  The only way for the housing market to improve at this juncture would be from gains in consumer income, which is not in the cars.


Hilsenrath to Wall Street: You don’t know Fed.

QE Infinity? No end in sight for money printing.

In Fed and Out, Many Now Think Inflation Helps – NYTimes.com.

Fed Balance Sheet vs. SP500 Last Year

If you wish to know the Fed’s future money printing output, this is the only chart you need to understand.  The Fed buys bonds, and the sellers invest those proceeds into stocks raising prices.  When the Fed stops or even threatens to stop, the whole trade begins unraveling. While the Fed claims to be concerned with unemployment and inflation, the Fed is extremely apprehensive about the consequences of a falling stock market.    Going forward, the Fed will continue to use low inflation and poor labor market data to justify continued printing to support both the government bond and stock markets.

Analysis: Convalescent euro zone seeks to escape debt overhang | Reuters.

Currency Woes Batter Europe’s Industrial Giants – WSJ.com.

EURUSD 10.28.2013

From Yahoo Finance

The Eurozone and the MFP is really counting on PIIGS exports continuing their rise in order to support the Eurocrisis Recovery Narrative.  Unfortunately, a rising euro will stop the export “boom” in its tracks.  The Euro will continue to rise as the Fed continues to print.  Moreover, Eurozone banks are still selling overseas assets to bolster capital ratios back home.  This process has created  background buying pressure on the euro that may even pick up as these backs clean up their balance sheets in advance of the commencement of the “banking union” in late 2014.

Not happy at work? Wait until you’re 50 or older….

This article is typical of the drivel spewing from the mouth of the MSM.  People report increasing job satisfaction after 50 because of some rather obvious selection bias.  People switch jobs several times over the course of their careers.  If your job sucks, you quit it in the hopes that the next job will be better.  This process will continue until you find a job that you enjoy.  Then, you will stay with it as long as you can.  It is not surprising that people settle into a comfort zone with their employment when they reach the last stages of their careers.  So the article’s advice to sit around and “just wait” until you’re 50 is poor advice.  It takes a lot of work to obtain satisfying work, so get to work already!

Around the Globe 10.25.2013

U.S. durable goods orders, sentiment suggest politics hurting economy | Reuters.

Durables rise, but aircraft surge hides underlying weakness.

Durable Goods Orders Through 09.2013

Durable goods orders are probably at or near peak at this stage of the “recovery.”  A large increase in orders for aircraft masked a 0.1% decrease in the rest of the series led by a 1.1% fall in capital spending.  Even though economic conditions remain tepid, the MFP is trotting out the government shutdown to explain this weakness despite the fact that the government shutdown occurred in October and the survey period was September.

Shutdown Dims Consumer Optimism – WSJ.com.

Consumer sentiment weakest since December 2012 in October.

U.S. consumer sentiment slides in October on government shutdown | Reuters.

Consumer Sentiment in U.S. Fell to 10-Month Low in October – Bloomberg.

UM Consumer Sentiment Through October 2013

According to the MFP, the dip in consumer sentiment was driven by the shutdown; yet, the shutdown began on October 1.  Consumer sentiment declined in both August and September prior to the shutdown.  The MFP recovery narrative controls all.  If the economic data does not confirm the narrative, then it is either ignored or explained away.  With the shutdown resolved for now, the MFP will have to rely on bad weather to provide appropriate economic excuses.

ECB Bond Figures Paint Picture of a Happier Euro Zone – MoneyBeat – WSJ.

Banks in Spain, France and Italy sell govt bonds in Sept -ECB | Reuters.


The recovery narrative is not just confined to the U.S.  The MFP reports that the eurozone is recovering, too. The latest “sign” is that European banks have begun reducing sovereign bond holdings with foreigners supposedly loading up on creaky euro sovereigns.  Once again, small, positive moves in the data have been distorted to conform to the narrative.

It is true that Spanish and Italian banks have reduced their holdings by €11.5bn and €8.1bn respectively, but these numbers are completely shorn of context in the article.  In percentage terms, Spanish banks reduced their sovereign holdings by 3.5% in the last quarter, and Italians sold 1.9% of their holdings.  To place these numbers in perspective, it would take Spain and Italy about four months just to sell the bonds they purchased in May.

The bond sales in the 3rd quarter represent a proverbial drop in the bucket of outstanding debt.  Italy is an excellent example of what has occurred during the Eurocrisis.  Notice that from late 2011 to early 2012, foreigners fled the Italian government bond market in droves and have not returned.  This is representative of the situation of all the PIIGS.  While the run has ceased, there has been no revival in foreign interest in this debt despite the anecdotal evidence presented in this article.

Italian Government Debt


Do you see a rebound in this chart? Needless to say, the article ends on a hopey note anyway:

But the crucial fact that they are now finding institutional buyers is a fresh pointer that the euro-zone is at least moving in the right direction.

Since banks are not really finding buyers for their sovereign bond holdings, we know that the Eurozone is not “moving in the right direction.”  Moreover, as this chart illustrates, the Eurozone financial system is increasingly becoming more balkanized as banks increase their domestic holdings, a trend that shows no signs of abating.

Financial Integration in the Eurozone